
Have you ever tried to build a model that can handle new data in real time? We set out to do just that, and discovered that there aren’t a lot of tutorials about training real-time machine learning models, so we made this one!
Editor’s Note: This project placed 1st for the Fall ‘23 MScADS Hackathon co-hosted by the UChicago Data Science Institute and Rotational Labs.
Abstract
Our goal for the hackathon was to develop a real-time flight delay prediction system to address the challenges faced by the aviation industry in mitigating the impact of flight delays, caused by combination of missed/slow connections, in-air delays, and scheduling disruptions. Based on personal experience, we know that consultants and others who travel often for work often disproportionately suffer from these delays, and we hoped to build something that would help those travelers.
We used Ensign, which is a cloud-based asynchronous data streaming tool developed by Rotational Labs to allow for real-time data pipelines through a publish/subscribe model. Our real-time flight delay predictor was an ideal problem to solve with Ensign, since it allows users to train event-driven ML models (such as through River) for practical use cases. It has a convenient Python SDK and is made by an awesome team of veteran data scientists with a lot of experience.
First, let me introduce the members of our hackathon team, The Three Musketeers:

For more information, our presentation can be found here.
Approach
Objective
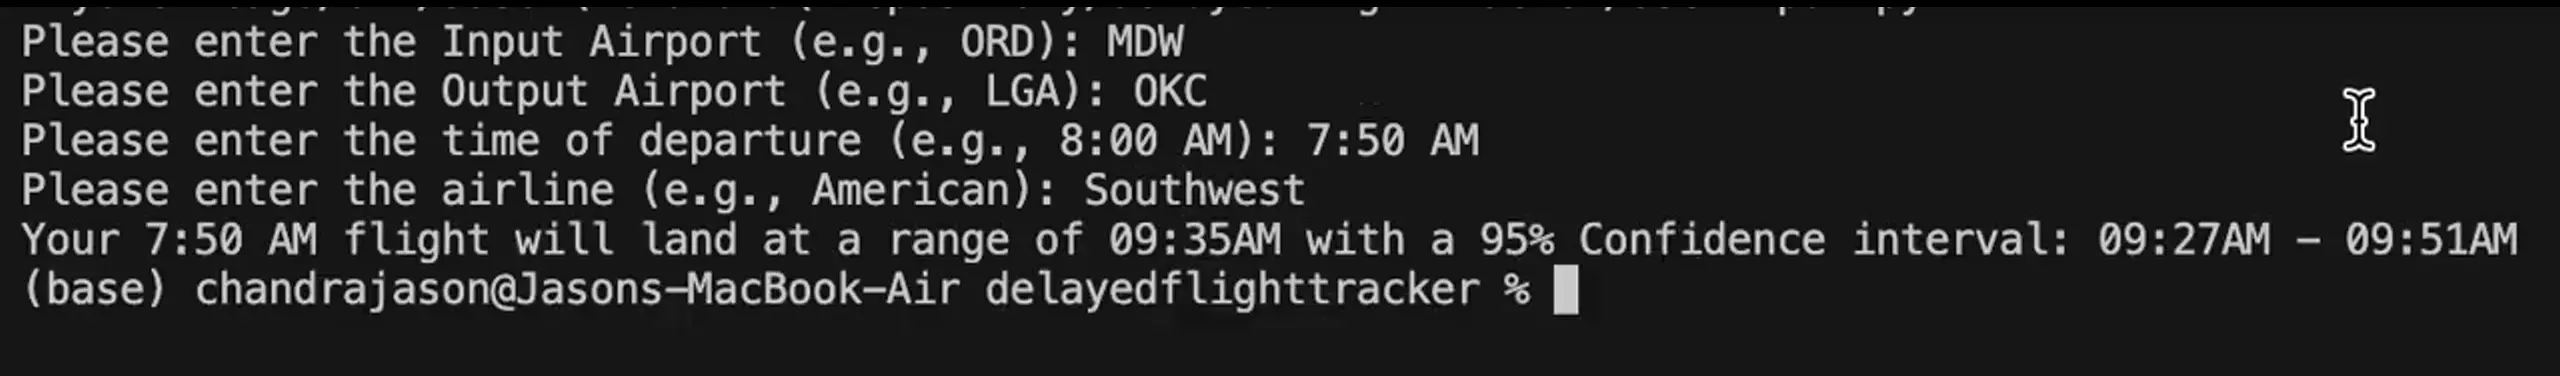
Our primary objective was to create a real-time flight delay prediction system tailored for consultants, helping them identify flights with expected delays, providing confidence intervals for predictions, and offering specific departure and arrival airport pair predictions to make informed travel decisions.
Given departure and arrival times for most frequent daily flights are the same, we decided to use historical airport/aircraft data, and flight path to predict the likelihood of delay, and update it through real-time tracking from our data pipeline.
We planned on retrieving live data from multiple sources, engineering a live data pipeline that could output ~5 relevant flights per second, with 30 pieces of info per flight. This data could then be fed into our event-driven model, with the goal of providing a continuously-updating predicted arrival time with a confidence interval backed by historical data and live updates.
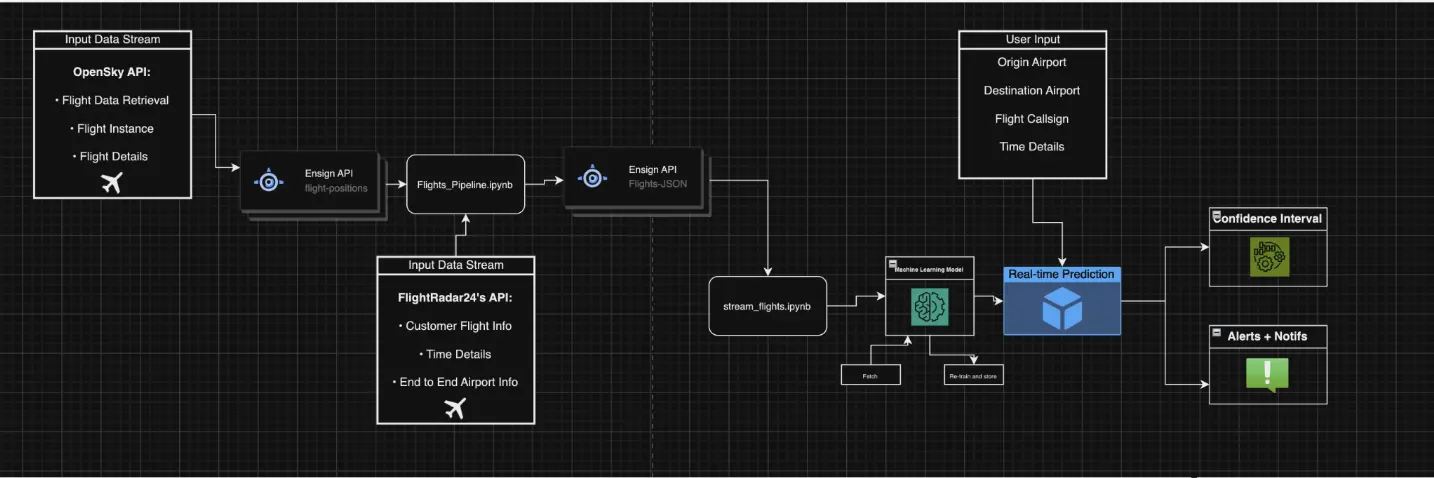
Data Pipeline
One of the keys to our success in the hackathon was that we designed our data architecture for our solution before we dove into the machine learning steps.
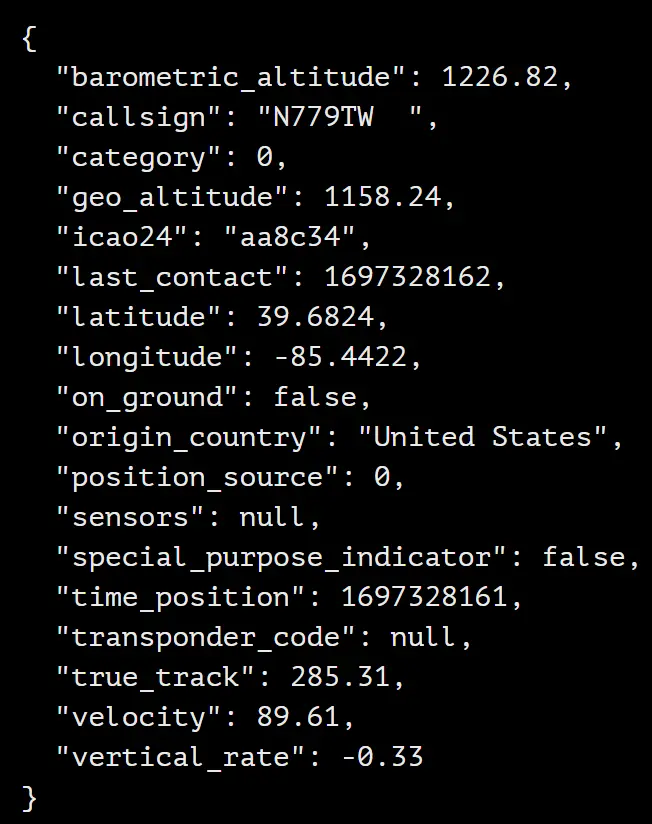
First, we utilised Ensign’s flight data from OpenSky Network’s live API to grab basic flight data. Each sample in the dataset represents a specific flight with various attributes related to that flight at one point in time (updated in 15-second intervals), such as a flight’s callsigns and ICAO24 registration, in-air info (velocity, altitude, horizontal/vertical headings, etc.), and flight type (aircraft model, passenger vs. cargo, etc.). We can pull 1000+ flights across the continental US per second with this model, although most flights are irrelevant and untracked by our pipeline.
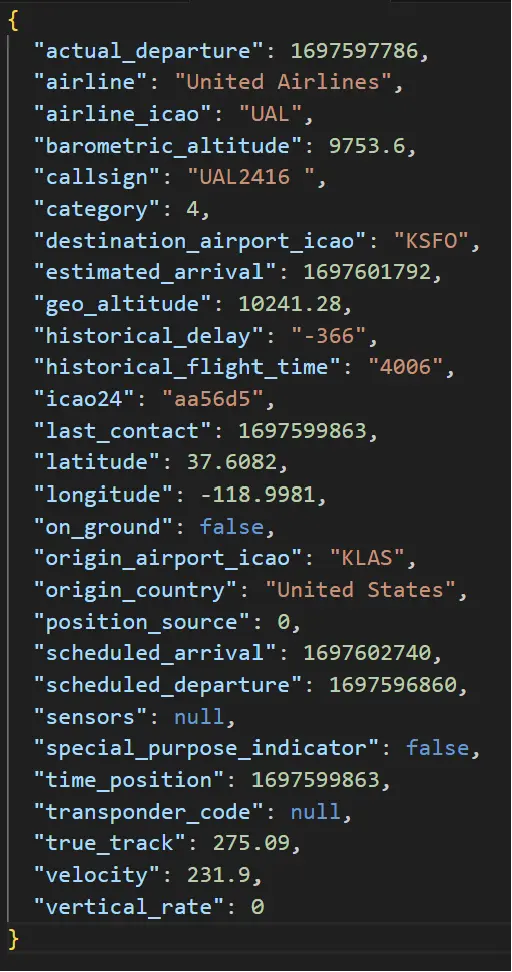
Next, we published this info into an intermediary topic, and subscribed with a pipeline file that filtered and processed this data. If a flight is “tracked”, our pipeline will take more detailed info from FlightRadar24’s API, grabbing airport-level data and detailed historical data to supplement each flight’s profile. This info is then published into a final topic, and subscribed to with our model to fetch real-time events for further training.
Finally, our model - a basic regression model - is then updated through incremental training. We conducted feature engineering through data selection (time-based features, historical data, and airport data were prioritised), scaling, and pre-processing. Model performance is validated through data splitting (80/10/10 split) and cross-validation, then using evaluation metrics such as RMSE, MAE and R-squared.
Given more time post-hackathon, we may try more complex versions of the model (e.g. polynomial regression, decision trees, random forests, etc.) and compare through k-cross validation performance.
Reflection
Our team had a great experience! We spent lots of time bouncing ideas off one another, and spent a lot of time encouraging and coding together for a common goal. As new data scientists, it allowed us to apply our rigorous academic takeaways to a practical goal, and tackle the challenges that arose from fitting theory into practice.
We learnt the importance of data engineering in practical data science work - it took up 75% of our time! Rotational Labs encouraged us to explore data engineering (which tends to be underappreciated), and we are much stronger at data engineering as a result.
Getting familiar with Ensign was a challenge for our team, and we wasted lots of time on pursuing solutions that fit with Ensign. The best solutions are only as good as the data quality/tools allow for, and these solutions tend to play to the strengths and integrate-ability of our various tools.
In the context of our flight delay prediction project, Ensign stands out (compared to Google Pub/Sub, Kafka, etc) due to its user-friendly interface, making it accessible for both beginners and experienced users. Its intuitive design and easy-to-navigate features allow fast adoption, enabling our team to efficiently utilize the tool without extensive training. Moreover, Ensign’s capability for rapid Minimum Viable Product (MVP) development is noteworthy, allowing us to swiftly prototype and iterate our real-time flight delay prediction system. Additionally, its built-in end-to-end encryption ensures data security, a critical aspect when handling sensitive flight information, enhancing our project’s integrity and compliance measures. These attributes collectively make Ensign a well-suited tool for our project, balancing usability, speed of development, and data security requirements.
Limitations
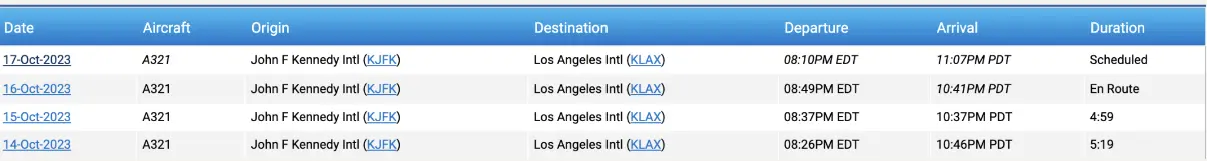
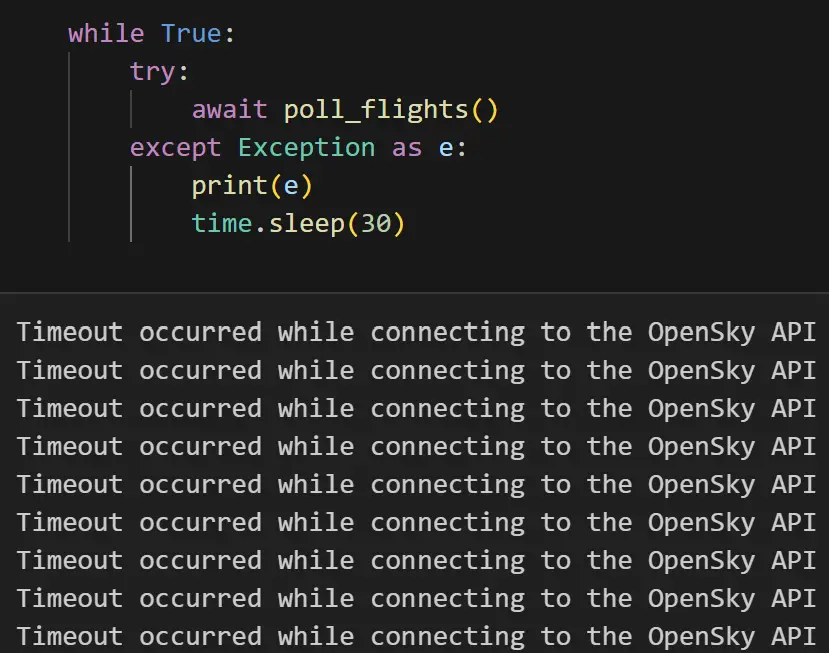
Given the short time duration of the hackathon (less than 2 weeks), we were heavily hampered by server-side unreliability issues from both APIs. OpenSky’s API was heavily rate-limited and frequently timed out our pipeline (as seen below), and FlightRadar24’s API could handle only ~1/50 of Ensign’s input, creating a bottleneck that forced us to implement arbitrary rate limiters in our pipeline - leading to decreased data quality (unpredictable/missing/incorrect rows) and poor data consistency.
The APIs could not integrate perfectly - OpenSky’s API only outputted airline registration info (24-bit ICAO/Callsign), while FlightRadar24’s API required aircraft registration info (tail number). Our creative solution was to create a tiny (~0.5 sq. mile) bounding box around each tracked aircraft, and identify the correct flight in each bounding box to retrieve flight details. This method definitely slowed our pipeline down, and did not always result in finding our flight due to data collection inaccuracies. If given more time, we would be able to come up with a more elegant solution.
All team members were new to data science (particularly ML), and had little coding experience. We struggled massively in building event-driven models, and had to learn real-time engineering/machine learning from scratch - this was a great experience! If given the chance to rebuild again with our current knowledge, we would have gone a lot further in the hackathon!
Further Expansions
Parallel to our primary focus on Ensign and real-time flight delay prediction, our project’s expansion ventured into leveraging Google Cloud Platform (GCP) and big data technologies, notably employing PySpark for advanced analytics. Through this expansion, we delved into two pivotal areas:
- Association Mining for Targeted Marketing: Identify traveler behavior patterns by uncovering correlations between airports and preferred airlines, aiding airline marketing teams in tailoring strategies for route planning and passenger engagement.
- Graph-Based Analysis for Delay Reduction: Utilize delay-integrated network representation to analyze delay propagation across airports and airlines, helping airline operations teams identify influential nodes and routes to minimize delays and enhance operational efficiency.
Our full exploration can be found Here for results and Here for the python code
Association rule mining
Association rule mining like FP-Growth used here, emphasizes discovering frequent patterns within transactions, beneficial for identifying strategic airline route planning rather than directly pinpointing airlines with the lowest delays for specific routes.
Specifically, we filter and analyze frequent itemsets and association rules based on high lift and support, centered on departures from ORD or MDW, aiding airlines in optimizing flight schedules and operations.
Our outcomes were the following:
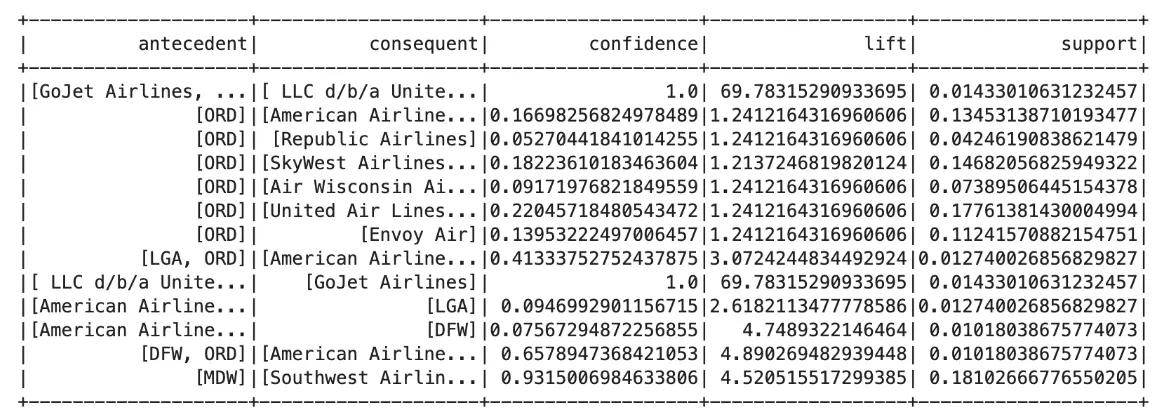
MDW (Chicago Midway International Airport) and Southwest Airlines: The association between MDW and Southwest Airlines reveals a very high confidence level (93.15%) and a significant lift value (4.52), indicating an extremely strong connection between Southwest Airlines and flights departing from MDW.
Strong Association with ORD (Chicago O’Hare Airport): American Airlines demonstrates a moderate confidence level (16%) with ORD, indicating a significant association with the airport, along with other airlines like SkyWest Airlines and United Airlines. The high lift values (>1) suggest these airlines are more frequently associated with ORD than expected randomly.
Connection between Airports (e.g., ORD and LGA): The association rule between LGA (LaGuardia Airport) and ORD (Chicago O’Hare Airport) with American Airlines shows a high confidence level (41.3%), indicating a strong association between these airports in terms of flights operated by American Airlines. The notably high lift value (3.07) indicates a substantial influence or relationship between American Airlines’ flights from LGA to ORD.
Graph Theory
For traveler segments aiming to reduce delays and explore diverse route options, like consultants seeking efficient travel, we’re exploring an alternative strategy beyond association mining.
Our new approach involves leveraging graph theory, where airports are represented as nodes in a network, connected by edges that signify relationships based on shared passengers or historical delay occurrences. What makes this approach innovative is how we’re integrating delay information into this network structure. Each connection’s strength is determined by historical delay data, factoring in both departure and arrival times.
By using this graph-based model, our goal is to create a more comprehensive analysis. This way, we don’t just identify commonly used routes but also consider historical delay trends. It’s all about providing a refined framework that caters to travelers looking for smoother, less-delayed travel experiences and a wider array of travel choices.
There are 3 different applications that can be used here:
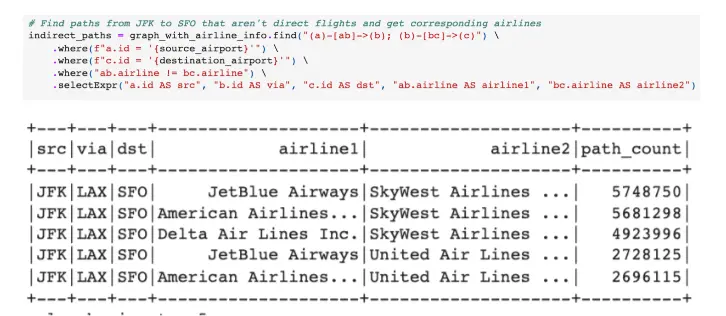
- Exploration of Indirect Flight Paths (JFK to SFO) by Top Airlines Consultants would benefit from this analysis if there are no direct flights between JFK and SFO as it helps identify popular indirect routes. Airlines, by leveraging this analysis, can identify market gaps, optimize their flight schedules, and potentially introduce new routes based on the demand for indirect flights between these two airports.
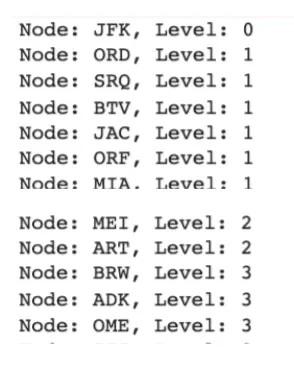
- BFS (Breadth-First Search) algorithm considering delays in a graph (representing airline connections) The algorithm computes levels (or distances) between nodes (airports) while factoring in delays as weights on edges (routes). Levels are determined by incrementally adding delays to the current level as the algorithm traverses the graph, helping airlines understand the impact of delays on the connectivity and distances between airports in their network.
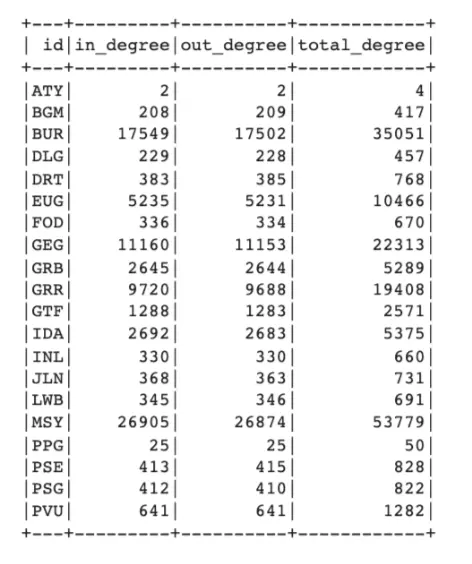
- Airline Route Optimization: Leveraging High Connectivity Airports for Enhanced Efficiency Understanding the principles of in-degree and out-degree is essential: in-degree represents flights arriving at an airport, while out-degree signifies flights departing from an airport. For instance, let’s take a look at Burbank Airport (BUR). It displays a total degree of 35,051, attributed to its 17,549 incoming and 17,502 outgoing flights, indicating significant connectivity. This information presents a potential strategy for airlines to refine their flight schedules efficiently. By prioritizing routes linked to airports with substantial connectivity, airlines can optimize their flight networks, potentially streamlining operations and offering improved travel options.
Next Steps
Improve our model performance (as stated in the limitation section)
Further steps could involve real-time implementation and integration with travel platforms, enhancing the user experience for consultants and travelers.
Future extensions: expanding the system to cover a broader range of flights and regions. Or, we could integrate additional features, such as weather data, to enhance prediction accuracy and further empower air travelers.
Turning it into a web app. Rotational Labs recently posted an article here that would allow us to deploy this into an app - which we are currently exploring right now.
Photo by NASA Commons CD99-0095-1.1