
Good software development achieves complexity by describing the interactions of simple components. Of course, this is harder than it sounds, and if Mark Twain had been a software developer he would have likely said: “if I had more time, I would have created a simpler design.” This feels even more true at the start of a project when a roadmap has to be laid out and time and cost estimates applied.
One of the primary challenges to simplicity lies in the conflict between how we tend to think of software processes: as step-by-step “wizards”, and the need to overlay this process on decoupled components whose interactions are distinctly non-linear. Agile software development workflows have identified this conflict and have designed processes to handle it including story based requirements gathering and iterative development cycles. This is my comfort zone, however, I’ve found myself in a new context recently: having to sunrise multiple projects simultaneously and plan discrete contracts with fixed budget and staffing.
Project sunrise planning reintroduces the challenge of decomposing complex design requirements into simpler components with a network of interactions. Unlike the feature enhancement and maintainance mode of iterative prototypes that may continue in perpetuity, sunrise planning has to be done up front to set a clear direction for the project. Moreover, this type of planning has to produce estimates that are “in the ballpark” while still being flexible enough to allow for changes in requirements as the project progresses. As I’ve been engaged in this context, two primary questions have come to mind:
Why should our software project planning be defined in a linear progression of steps with time estimates? Can we plan projects using a non-linear workflow that mirrors how we think about component design?
A Visual Solution
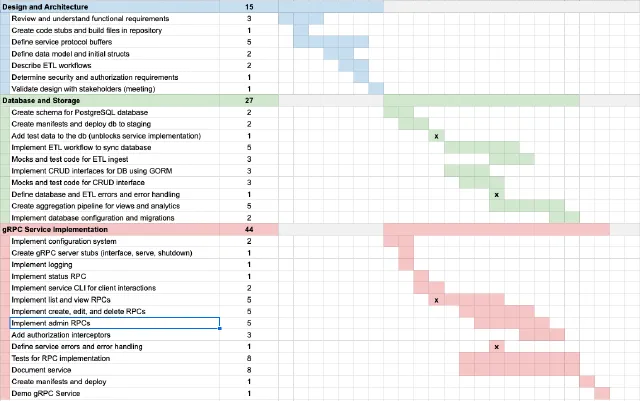
Complex relationships are best represented visually, and I began to experiment visualizing the task planning process. My first instinct to handle task dependencies was to draw a network diagram of tasks and relationships. While interesting, this diagram was not well suited to task decomposition or groups, gets complex fast, and really has no room for text. After a couple of more tries, I landed at a visual planning solution shown in the figure above.
The left side of the figure shows a 2-level hierarchy of tasks that represent decomposition in the planning process - first major tasks are described, then subtasks for each major task can be planned out. Each task is assigned a level of work estimate in the second column — in this case using Fibonacci numbers, though I think t-shirt sizes would also work well. So far, so normal - the novelty comes from the Gantt-esque chart on the right.
The right side of the figure is a temporal block chart where blocks of time correspond to one unit of estimated work. If a task is estimated at 3 points, then it takes three blocks in the temporal chart. Unlike Gantt charts, the blocks of time do not represent clock or calendar time, but instead represent “happens before” relationships. Tasks that are coupled or related are shown by overlapping time.
To illustrate these concepts, consider the tasks in the green section, “Create schema for PostgreSQL database” and “Create manifests and deploy DB to staging”. Both of these tasks must be completed before “Add test data to the db (unblocks service implementation)”. Another set of tasks, “Create schema” and “Create manifests” are overlapping tasks — there is work that can be done in parallel between the schema and the manifests, but at some point the manifests need the schema in order to be complete.
At this point, I was fairly dismayed by my results. Gantt charts bring to mind a Waterfall engineering practice, which, rightly or wrongly, triggers me as a long time Agile practioner. The visualization does have some challenges, which I’ll discuss shortly. Bear with me, though - for planning purposes this chart was surprisingly effective and revealed that there are actually different kind of task interdependencies!
3 Types of Interdependencies
By describing task relationships this way, dependencies between tasks become quickly apparent without specifying a DAG or other relationship diagram. These dependencies also assist in collaboration and team assignment, which show what flexbililty is needed during planning. Loosely, we’ve identified three types of interdependencies that reveal themselves in the planning process: hard, fuzzy, and parallel.
Hard dependencies are mutually blocking and are visually illustrated by the “depends on” relationship. Here a subtask or even a major task cannot be started until the dependent tasks have been completed. These tasks should be assigned to individual contributors and scheduled in sprints accordingly.
Fuzzy dependencies, on the other hand, show tasks that are related as visually illustrated by the staggering of proximal subtasks. These tasks are co-evolving and require dialog between the participants involved in them. If multiple team members are assigned these types of task, they should expect to communicate often and effectively about their progress and design choices.
Parallel tasks are completely independent and are visually illustrated by distance from other tasks or starting at the same time as other tasks. These tasks can be safely assigned to different team members without much need for a check-in until a hard dependency interrupts the process.
There could easily be more types of interdependencies, but thinking of tasks this way greatly simplified our sunrise planning and gave us increased flexibility when making choices about how to plan sprints and assign team members. There were a few challenges, however.
Challenges
This visual planning method makes interdependencies between subtasks easy to describe, but dependencies across subtasks in different major tasks are much more difficult. To show this I’ve added “x” marks to dependent subtasks in across major tasks, but it would be better if the relationships across major tasks could be “trusted”. Part of the detection of interdependencies described in the previous section required proximity, however by design, related subtasks across major tasks cannot be close together, moreover the planning process against major tasks tends to be independent. This leads to the question “can I trust the temporal relationships of subtasks between tasks, or are they totally independent?”. A visual method must express this.
The second challenge comes in sprint planning. If this chart was to be used in daily Agile practice rather than simply as a sunrise planning tool, it would have to be dynamic. This would require a distinction between actual and predicted relationships, and the ability to add new major and subtasks as the project continued.
This visual planning experiment led to an interesting initial result, but I think more work and experimentation is needed. I envision more focused sprint planning where the only tasks that are considered are the tasks that are available at the point in the temporal flow chart at the time of the sprint, and as many tasks as there are points available in the sprint are collected into it.
The next step would be to prototype a planning tool that allowed you to easily add major tasks and subtasks with time estimates. Then by simply clicking on a block the time would be filled in. The major task would automatically be updated with the full estimate and the time window it’s in. Groups of tasks could be moved left or right together. This level of interactivity would make planning much more effective!
We will likely continue experimentation on this process and research related techniques. In the meantime, we would love to hear how this visual planning process would influence your workflows (good and bad) and what other considerations we should keep in mind!