
The last few years have marked a shift in industry away from research-oriented machine learning. These days, shipping models early and often is critical, and open source tools like Prefect can speed up the process of operationalizing ML.
2024 finds us an AI arms race, where companies are rushing to get value out of AI and feeling the pressure to deploy solutions quickly so that they don’t get scooped by competitors.
For those of us from a more traditional data science background where a deep understanding of the algorithms was the main focus of our education, shifting to this new paradigm has caused growing pains. It already takes an inordinate amount of time working with data and making sense of it to build a machine learning model, let alone having to now manage application development and deployments.
Fortunately, there are many new tools that are now available that take away some of the complexities around operationalizing and managing machine learning models. Prefect is a modern workflow orchestration platform designed specifically for data practitioners to help them manage their workflows and to add observability into their applications without having to write custom code. Even better, it’s written in Python, which makes it feel more approachable than other devOps/MLOps tools.
Just here for the code? Check out the git repo here.
Getting Started
Prefect offers a lot of neat features but what’s even more awesome is that getting started is SUPER easy. All it takes to integrate Prefect into your application workflow is four steps:
- Install Prefect in a virtual environment like you would any other package:
pip install prefect. - For functions within your application that you want to monitor, e.g.,
scorefor monitoring model predictions, add the@flowdecorator on top of the function signature. - Run the following command in a terminal window:
prefect server start(note that your virtual environment must be activated before running this command). - Run your application and view the live status of the application in the Prefect dashboard.
The example I will demonstrate is a real-time sentiment analysis application that uses Ensign as the streaming data platform, River for the real-time machine learning model, and Prefect as the orchestration platform. We’ll use this sample dataset of Yelp reviews as a stand-in for the data streaming into our to-be-deployed model.
For those of you who have read some of my previous blog posts, you will recognize that the code that I am using is eerily similar to one that I used in an earlier blog post 😜. This proves that it doesn’t take much to integrate Prefect into an existing application.
If you are not familiar with Ensign, check out Ensign U to learn more about how you can use Ensign to build real-time applications. For this application you will need to create two topics: river_pipeline and river_metrics. Topics are analogous to tables in a relational database.
Architecture
This application consists of three components:
- A publisher component that reads data from a csv file that contains review data and publishes (writes) this data to the
river_pipelinetopic. - A subscriber component that listens for new messages on the
river_pipelinetopic and loads and uses a real-time machine learning model that makes predictions and learns incrementally as it receives new training instances. At the end, it calculates the precision and recall scores which it publishes to a different topic calledriver_metrics. - The third component listens for new messages on the
river_metricstopic and checks to see if the precision or recall scores are below a pre-specified threshold and logs the values if they fall below the threshold.
As you can imagine, especially with real-time applications that are going to be running on an ongoing basis, it is crucial that there is monitoring set up so that you can view the health and status of your applications and can address issues as soon as they arise.
Let’s now take a look at some code and see how to integrate Prefect into the application.
Going with the Flow
The first key component of an operationalized model is a steady stream of input data, ready for training or prediction. In a live application, this could be a batch-wise process, a request-response model, or a real-time feed of streaming updates.
For this example, let’s imagine we have a real-time data feed that we would like to connect our model to. Let’s write a publisher class with a method to emulate that real-time feed so we can get put together an end-to-end architecture.
class DataPublisher():
    """Emulate real-time ingestion"""

    # ...
    # ...

    async def publish(self):
        """
        Read data from the yelp.csv file and publish to river_pipeline topic.
        This can be replaced by a real time streaming source
        Check out https://github.com/rotationalio/data-playground for examples
        """
        train_df = pd.read_csv(os.path.join("data", "yelp.csv"))
        train_dict = train_df.to_dict("records")
        for record in train_dict:
            event = Event(json.dumps(record).encode("utf-8"), mimetype="application/json")
            await self.ensign.publish(self.topic, event, on_ack=handle_ack, on_nack=handle_nack)
This function reads a csv file and converts it to a Pandas dataframe that is then converted to a list of dictionary objects. It loops through this list of dictionary objects one record at a time and converts them into Ensign events that are published (stored) in the river_pipeline topic. In our hypothetical application, this will eventually get swapped out with a real-time source accessed through an API.
In order to integrate Prefect into this application, we will write another function that instantiates the DataPublisher class and calls publish.
@flow(log_prints=True)
def run_data_publisher():
    publisher = DataPublisher()
    asyncio.run(publisher.publish())
The flow decorator converts the function into a Prefect Flow, which is a special function that can be monitored and can optionally have built-in retries if specified. The log_prints parameter converts the print statements to INFO level log messages. If you want to set up other types of logging messages such as WARNING and ERROR messages, you can use get_run_logger from Prefect. We will see this example in the Metrics Subscriber component.
The other item to note above is the use of asyncio.run before the function call. Since the publish method is asynchronous we use asyncio to call the function. Asynchronous functions are common in real-time applications where functions need to have the ability to run independently of each other.
And that’s all it takes to monitor the Data Publisher component!
Serving Data to a Real-Time Model
Now we need to serve that incoming data to our model. Let’s create a second class that will subscribe to the data feed and invoke the model whenever a new event (aka data point) arrives.
class DataSubscriber():
    """Serve data to the model"""

    # ...
    # ...
    async def subscribe(self):
        """
        Receive messages from river_pipeline topic
        """
        async for event in self.ensign.subscribe(self.sub_topic):
            await self.run_model_pipeline(event)
The run_model_pipeline function will use the new data to update a real-time version of a Multinomial Naive Bayes classifier that is wrapped in a Pipeline object with a bag-of-words vectorizer.
Note: This uses the concept of online machine learning, which is a good alternative to wholesale batchwise retraining, because it allows the model to learn incrementally. For those not familiar with real-time ML models, this might look backwards!.
async def run_model_pipeline(self, event):
    """
    Make a prediction and update metrics based on the predicted value
    and the actual value.
    Incrementally learn/update model based on the actual value
    """
    record = json.loads(event.data)
    y_pred = self.model.predict_one(record["text"])
    if y_pred is not None:
        self.confusion_matrix.update(y_true=record["sentiment"], y_pred=y_pred)
        self.classification_report.update(y_true=record["sentiment"], y_pred=y_pred)
    # the precision and recall won't be great at first, but as the model learns on
    # new data, the scores improve
    print(self.precision_recall)
    pr_list = self.precision_recall.get()
    pr_dict = {"precision": pr_list[0], "recall": pr_list[1]}
    event = Event(json.dumps(pr_dict).encode("utf-8"), mimetype="application/json")
    await self.ensign.publish(self.pub_topic, event, on_ack=handle_ack, on_nack=handle_nack)
    # learn from the train example and update the model
    self.model.learn_one(record["text"], record["sentiment"])
With traditional models, we typically fit a model to a batch of data and then run predictions on new data. Real-time machine learning models make predictions first on new data and then learn on that data when the label becomes available. We have the labels, so we will simply make the prediction first by calling predict_one and then call learn_one on the same data. We will also update the confusion matrix and the classification report using the prediction and the label. Finally, the latest precision and recall scores are published to the river_metrics topic.
We will integrate Prefect as shown below. Note that it looks almost the same as the function that was used for the Data Publisher component.
@flow(log_prints=True)
def run_data_subscriber():
    subscriber = DataSubscriber()
    asyncio.run(subscriber.subscribe())
Enabling Model Observability
For most machine learning models, we want to be able to track model performance so that we can ensure that it is functioning correcting. Because this model gets updated incrementally as new data flows through, we can instrument a model metrics checker to give us insight into the real-time training process.
The class used in this component is called MetricsSubscriber and the top level function is also called subscribe. It calls another function called check_metrics which is defined below.
class MetricsSubscriber():
    """Enable real-time model metrics observability"""
    # ...
    # ...
    async def check_metrics(self, event):
        """
        Check precision and recall metrics and print if below threshold
        """
        metric_info = json.loads(event.data)
        precision = metric_info["precision"]
        recall = metric_info["recall"]
        if precision < self.threshold:
            self.logger.warn(f"Precision is below threshold: {precision}")
        if recall < self.threshold:
            self.logger.warn(f"Recall is below threshold: {recall}”)
For each event that arrives on the river_metrics topic, it extracts the precision and recall scores and checks to see if the scores are below a pre-defined threshold. You will notice here that the print statements are replaced by a logger which is instantiated in the class using Prefect’s get_run_logger method. In this case, we want to log a WARNING message so that the person who is monitoring the application can check to see if this is something that needs to be addressed. The following code snippet shows how Prefect is integrated here. You can see how the logger is initialized and passed to the MetricsSubscriber class as a parameter.
@flow(log_prints=True)
def run_metrics_subscriber():
    logger = get_run_logger()
    subscriber = MetricsSubscriber(logger=logger)
    asyncio.run(subscriber.subscribe())
Running the Application
Now let’s put all the pieces together and run our application! Go here to find the full source code and make sure you have the dependencies needed to run the application.
Step 1: Create and source environment variables on your machine
In order to use Ensign, you will need to have downloaded API keys and set them as environment variables as follows:
export ENSIGN_CLIENT_ID="your client id here"
export ENSIGN_CLIENT_SECRET="your client secret here"
Step 2: Create and activate a Python virtual environment
$ virtualenv venv
$ source venv/bin/activate
Step 3: Install the required packages
$ pip install -r requirements.txt
Step 4: Set up and start the Prefect server
You can either host your own Prefect server on your own infrastructure or use Prefect Cloud. Follow the instructions after signing up to create a Prefect server on the cloud.
If you choose to set up a local server, you simply need to open up a terminal window and run the following command to get started. Make sure that Prefect is installed in your virtual environment first and that you have activated it. The command to run the Prefect server on your machine is as follows:
$ prefect server start
Step 5: Run the Metrics Subscriber
Open up a new terminal window and activate the virtual environment. Run the following command:
$ python river_sentiment_analysis.py metrics
Step 6: Run the Data Subscriber
Open up a new terminal window and activate the virtual environment. Run the following command:
$ python river_sentiment_analysis.py subscribe
Step 7: Run the Data Publisher
Open up a new terminal window and activate the virtual environment. Run the following command:
$ python river_sentiment_analysis.py publish
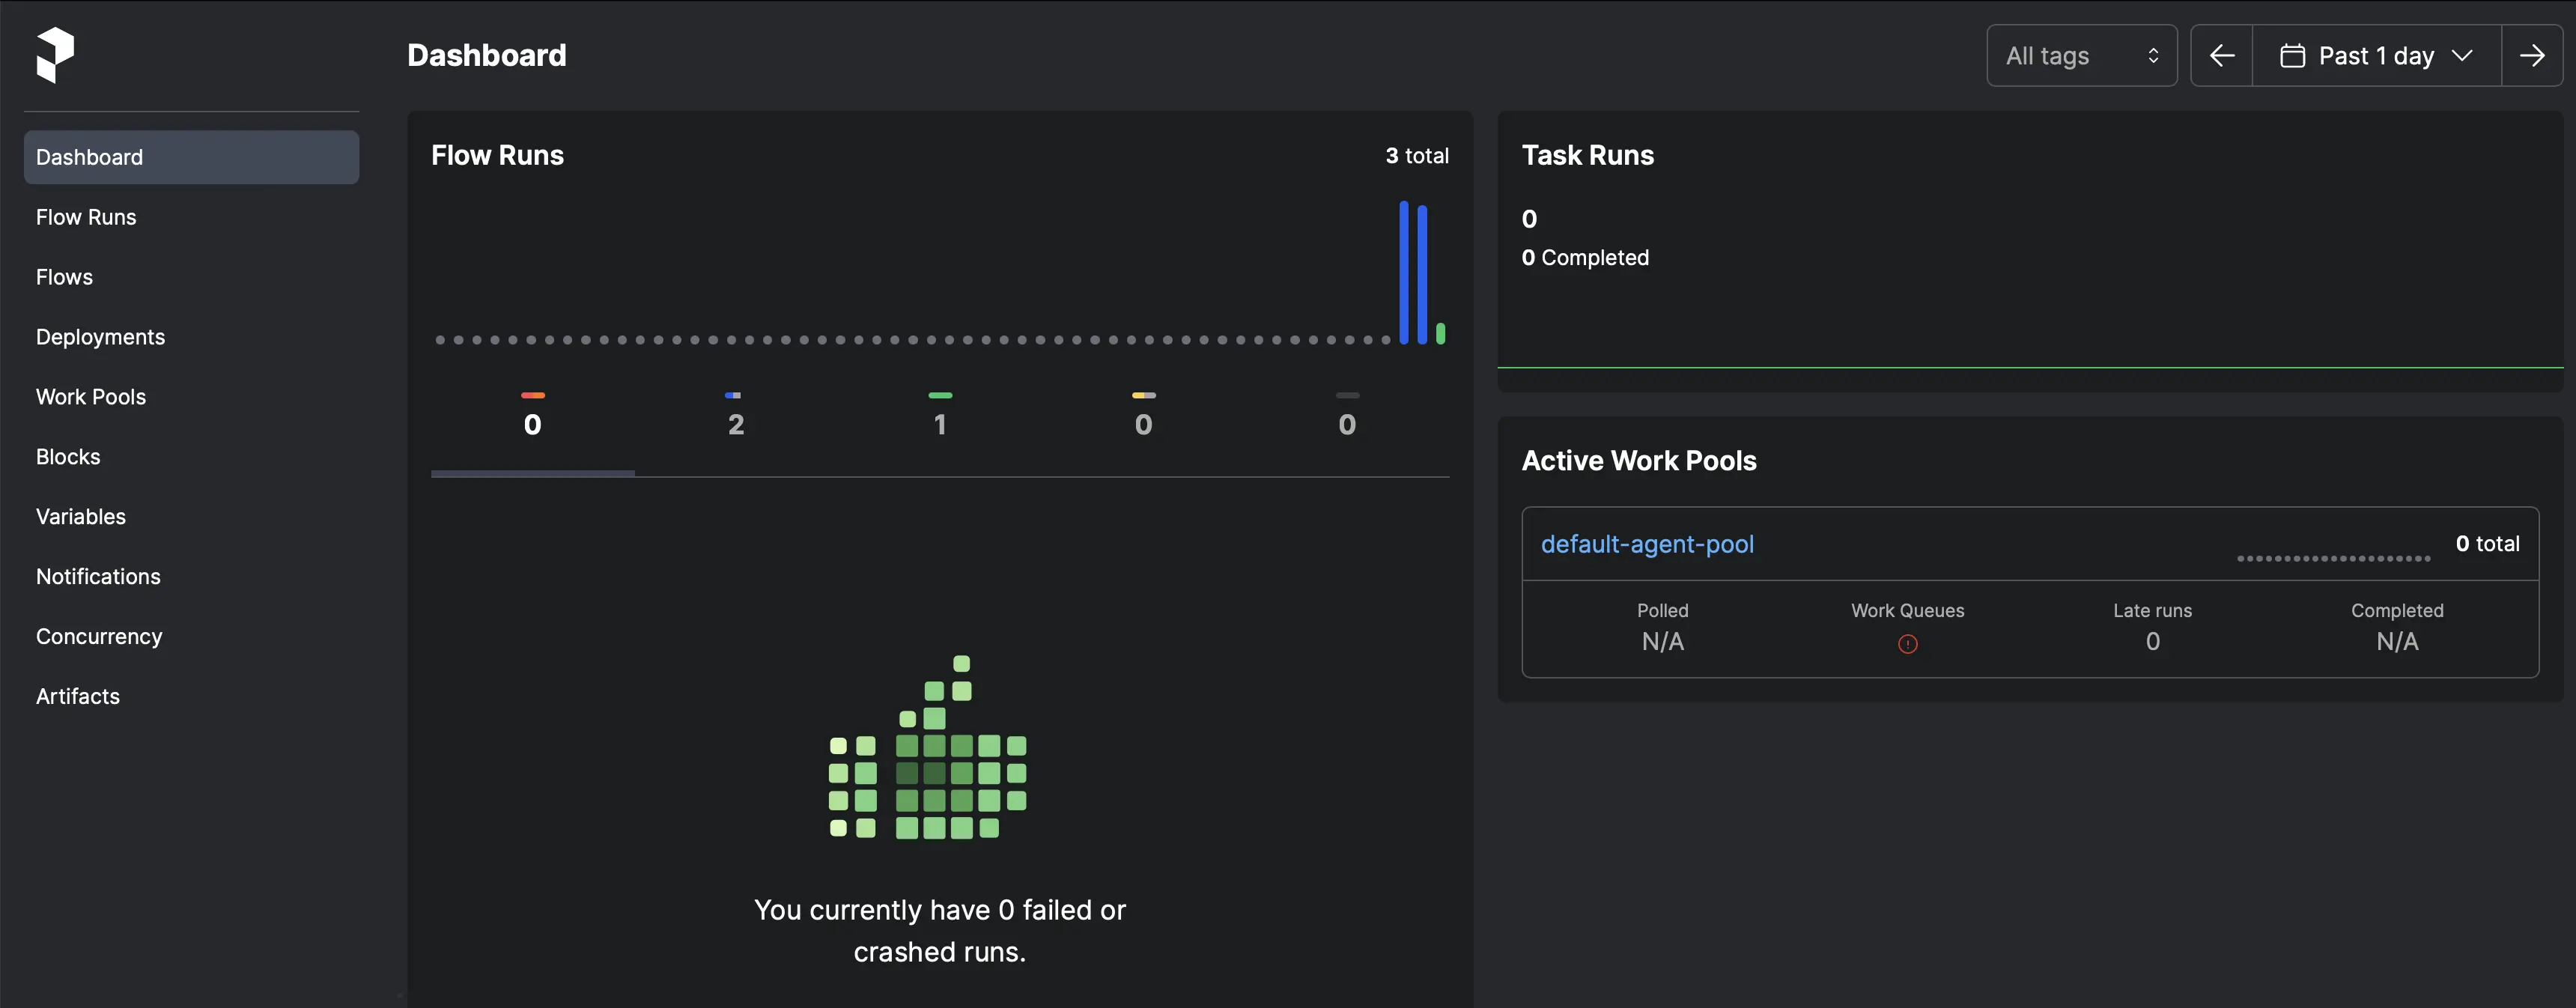
You can then take a look at the Prefect dashboard to view your jobs. It will look something like the screenshot below. Note that there are three bars below to the Flow Runs section. The two blue bars are the Data Subscriber and the Metrics Subscriber components. These are blue because they are still running. The green bar is the Data Publisher which is green because it finished running and it ran successfully. Since the publisher was reading from a csv file instead of a real-time API, it completed running after there were no more records in the csv file. You can see that the dashboard gives you a quick overview of the health and status of your application.
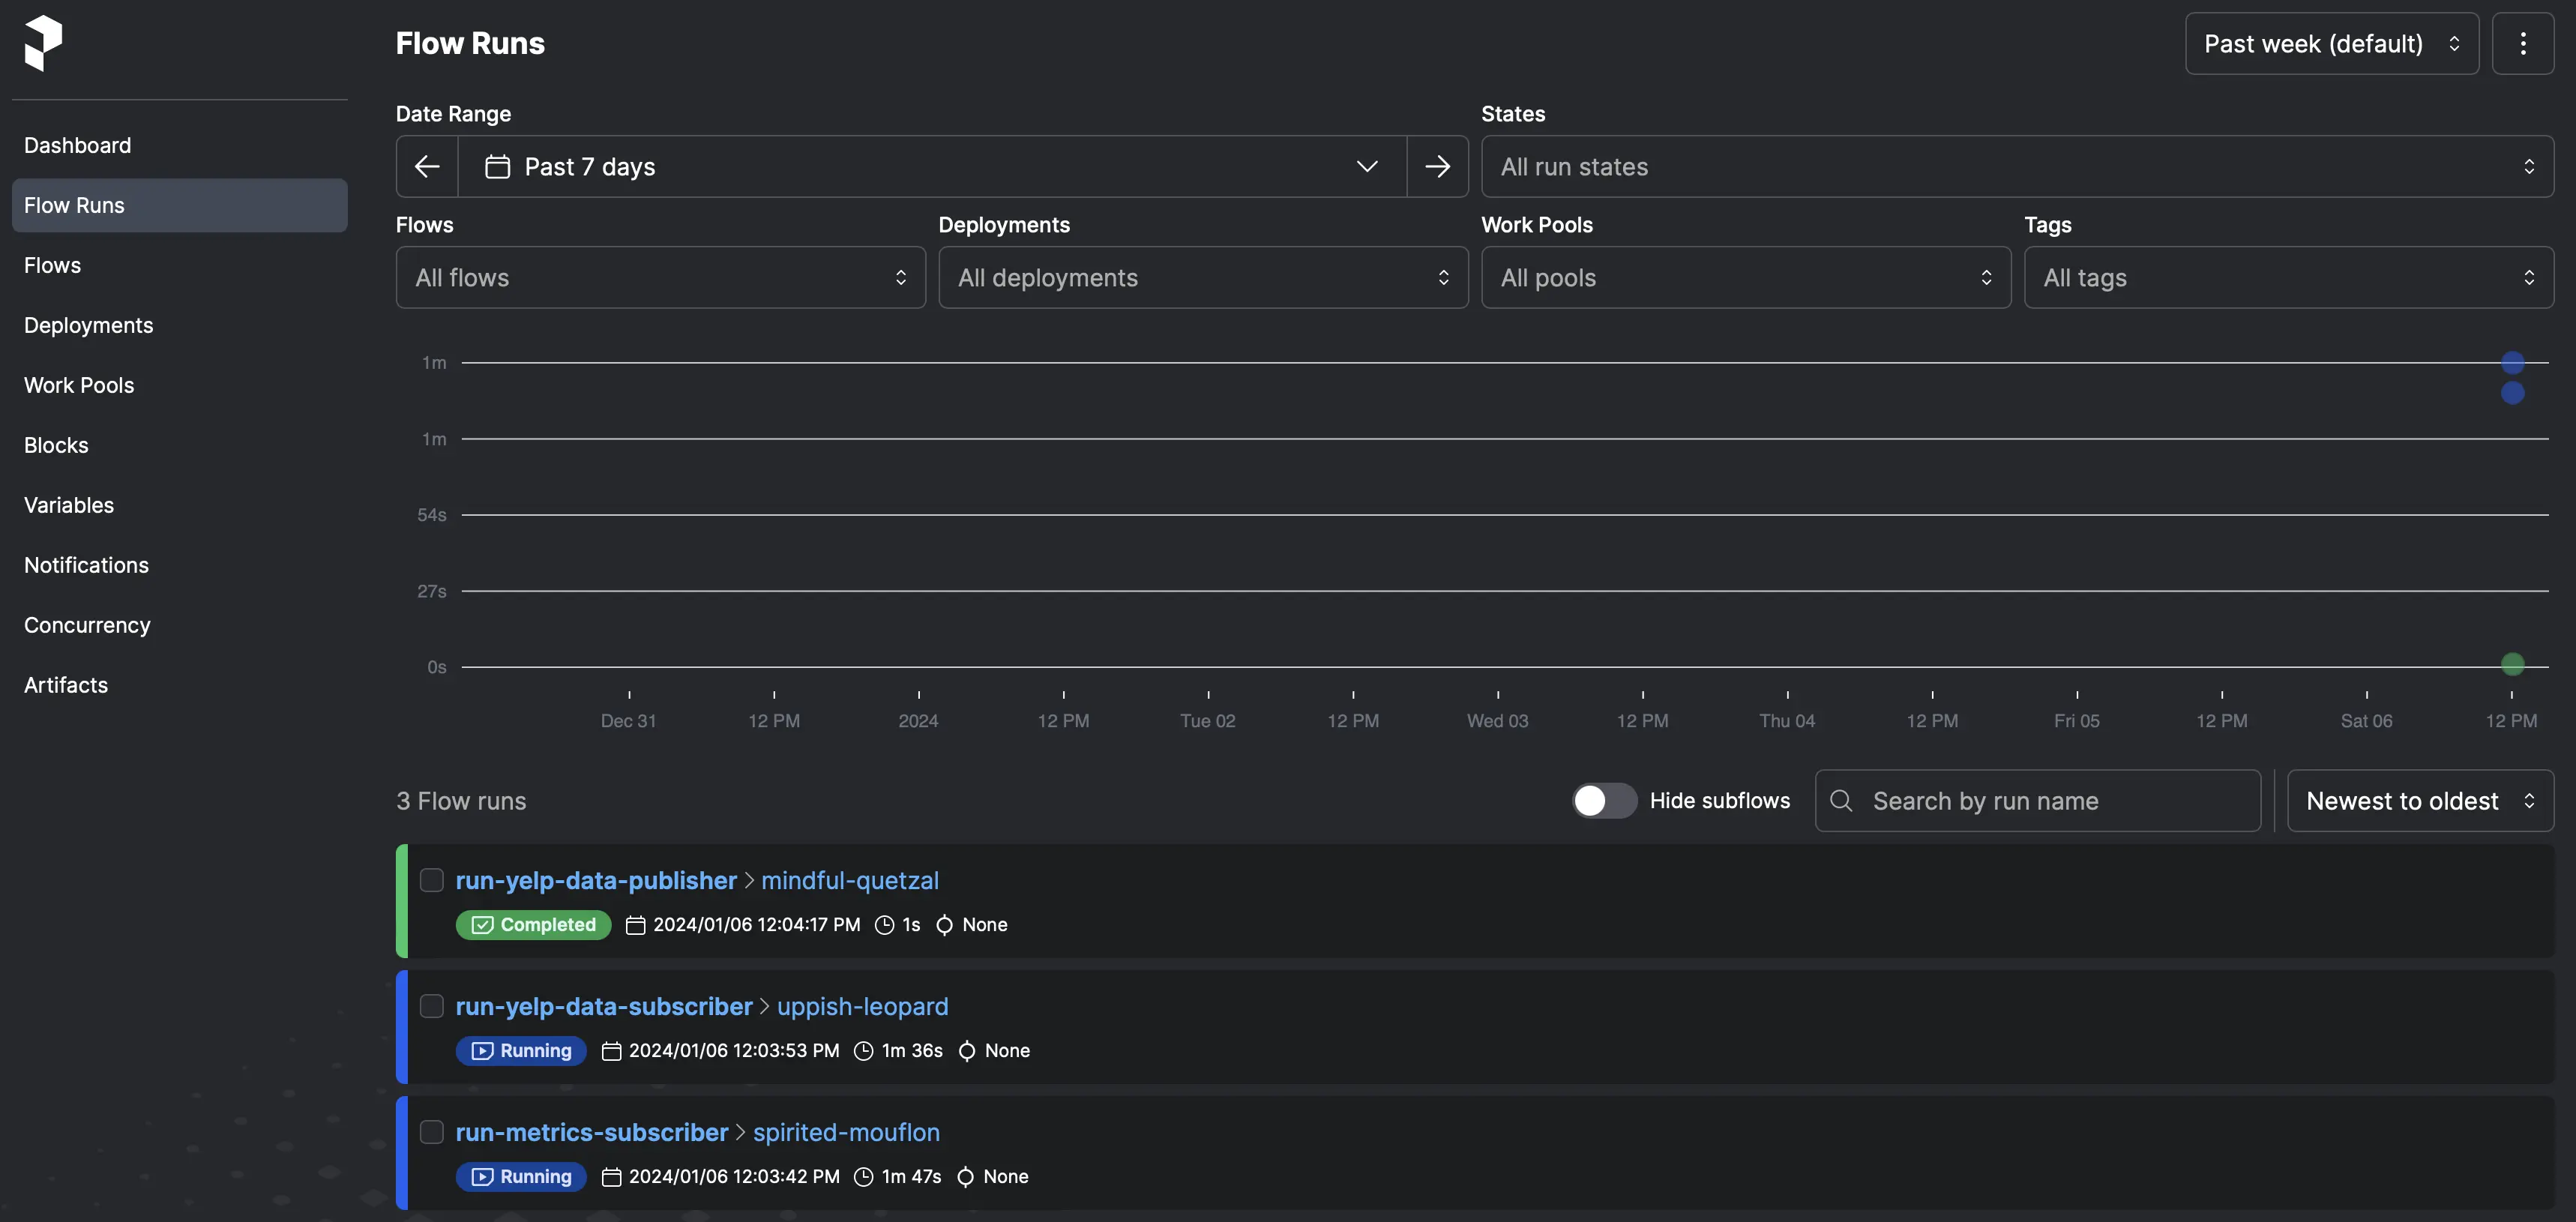
The following screenshot shows the Flow runs. This gives you the ability to drill down further into a single component.
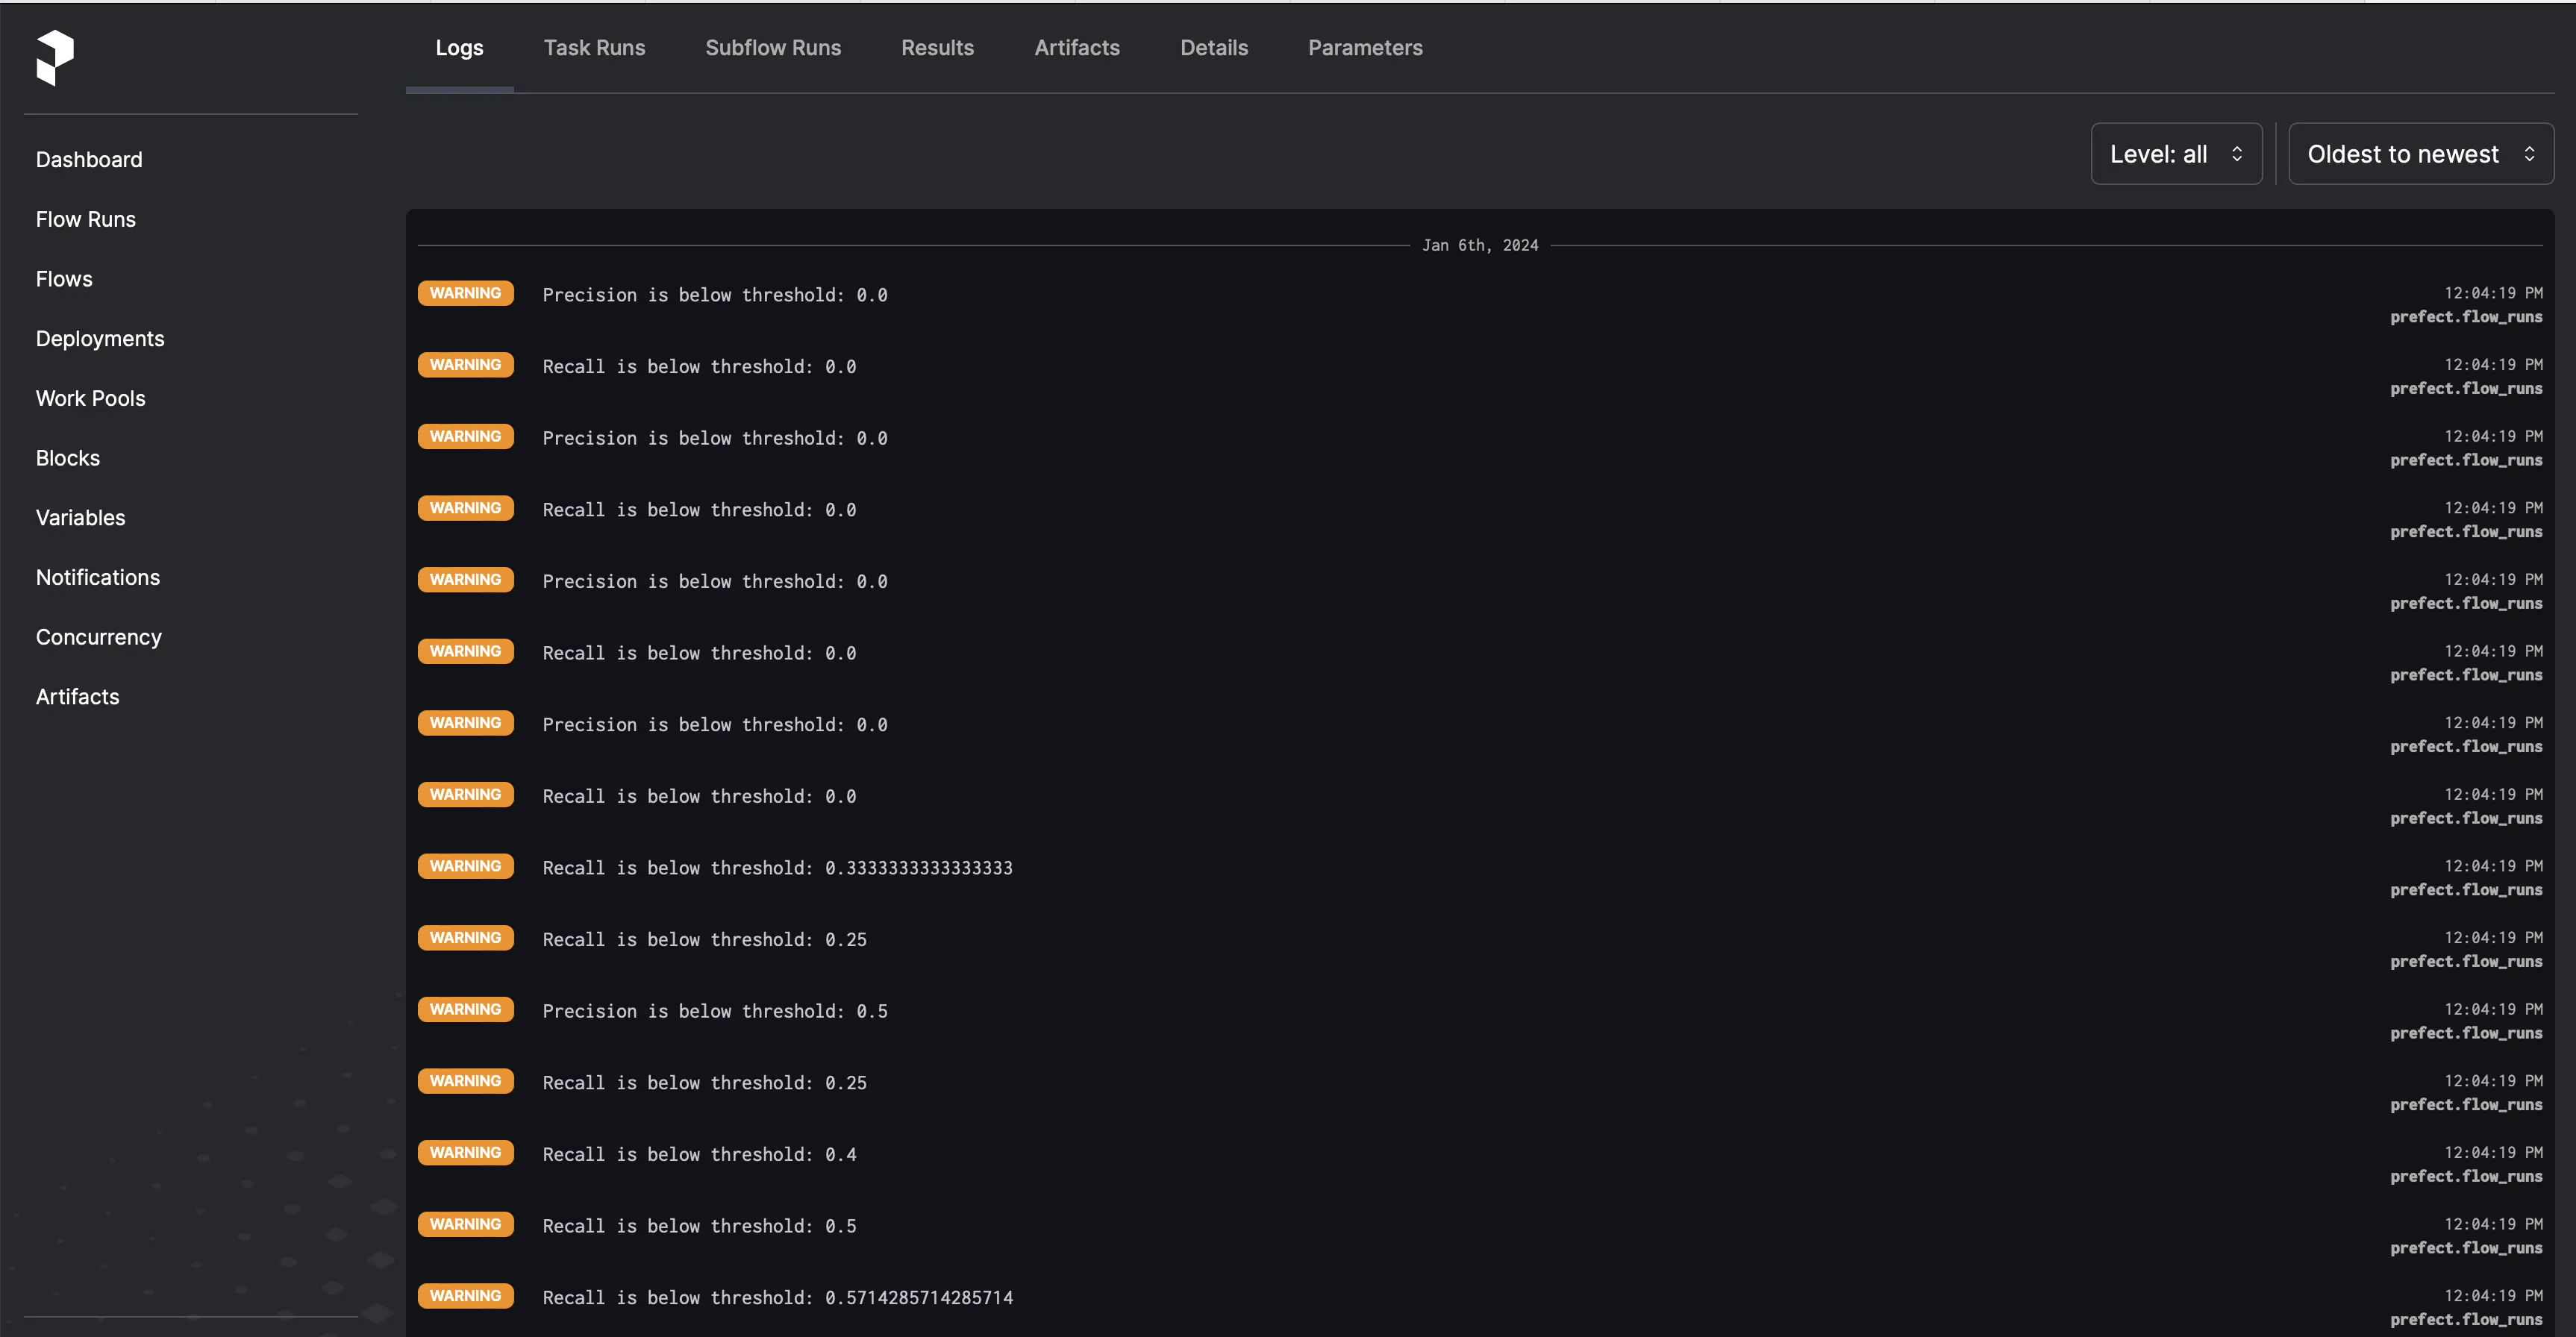
You can also check the logs for warnings and errors. Note you can see the instances where the precision and recall were lower than the threshold. One thing to note with real-time models is they tend to perform poorly at first and then get better over time as is evidenced by the screenshot below.
Prefect offers a lot more features not demonstrated in this example such as scheduling, notifications, and artifacts that can be used for data quality checks and documentation. These are particularly useful for analyzing results over time.
Conclusion
As you can see, integrating Prefect into an application is very straightforward. But more importantly, it empowers scrappy data teams to be self-reliant by adding observability into their own applications without having to rely on an external team to build one for them. And given the current “data science 2.0” climate where model deployment is becoming even more critical, leveraging a user-friendly tool like Prefect is the ideal solution to ensure that we remain competitive as data scientists.
Photo by Manuel Nägeli on Unsplash